Celestia Price Prediction for Today, September 14 – TIA Technical Analysis
Join Our Telegram channel to stay up to date on breaking news coverage
The Celestia price prediction reveals that TIA may find a halt at $4.0 as the price is down by 3.28% over the last 24 hours.
Celestia Prediction Statistics Data:
- Celestia price now – $4.36
- Celestia market cap – $919 million
- Celestia circulating supply – 210.7 million
- Celestia total supply – 1 billion
- Celestia Coinmarketcap ranking – #69
Investing early in crypto projects can offer significant rewards, as seen with Celestia’s recent performance. Over the past 24 hours, its price ranged from $4.08 to $4.59, reflecting typical market volatility. Despite a steep decline of -78.25% from its all-time high of $20.91 in February 2024, the token has rebounded by +124.23% since hitting its all-time low in October 2023, showcasing the potential for growth after downturns.
TIA/USD Market
Key Levels:
Resistance levels: $6.0, $6.5, $7.0
Support levels: $3.0, $2.5, $2.0
TIA/USD has been trading within a downward channel for several weeks following a rising wedge pattern breakdown. The price initially targeted $5 after the breakdown but fell further to $4.20, a key support level that has provided stability multiple times in the past. TIA dropped below this support zone recently but quickly recovered, signaling a potential short-term recovery within the formed descending channel. Moreover, if the bears continue to push the market further lower, immediate support below the $4.35 level may be located. Beneath this, further support may be found at $3.0, $2.5, and $2.0 levels.
Celestia Price Prediction: TIA Price May Retreat to Trade Bullishly
Analyzing the daily chart, TIA continues to move within the long-term downtrend channel that started in January 2024. The price has faced several rejections from the channel’s upper resistance and remains near the lower boundary. While it has attempted multiple bounces from this support, it has yet to break out of the larger downtrend.
Nevertheless, a breakdown below the 9-day moving average could push the price further down, with a technical target of around $4.0.However, this would require a significant bearish move, which may be difficult given the established support within the channel. On the other hand, if TIA breaks above the 21-day moving average to hit the nearest resistance level of $54.8, it could aim for the $5.0 level, setting the stage for a potential breakout from the larger downtrend which could locate the resistance levels of $6.0, $6.5 and $7.0 respectively.
TIA/BTC Keeps Ranging within the Channel
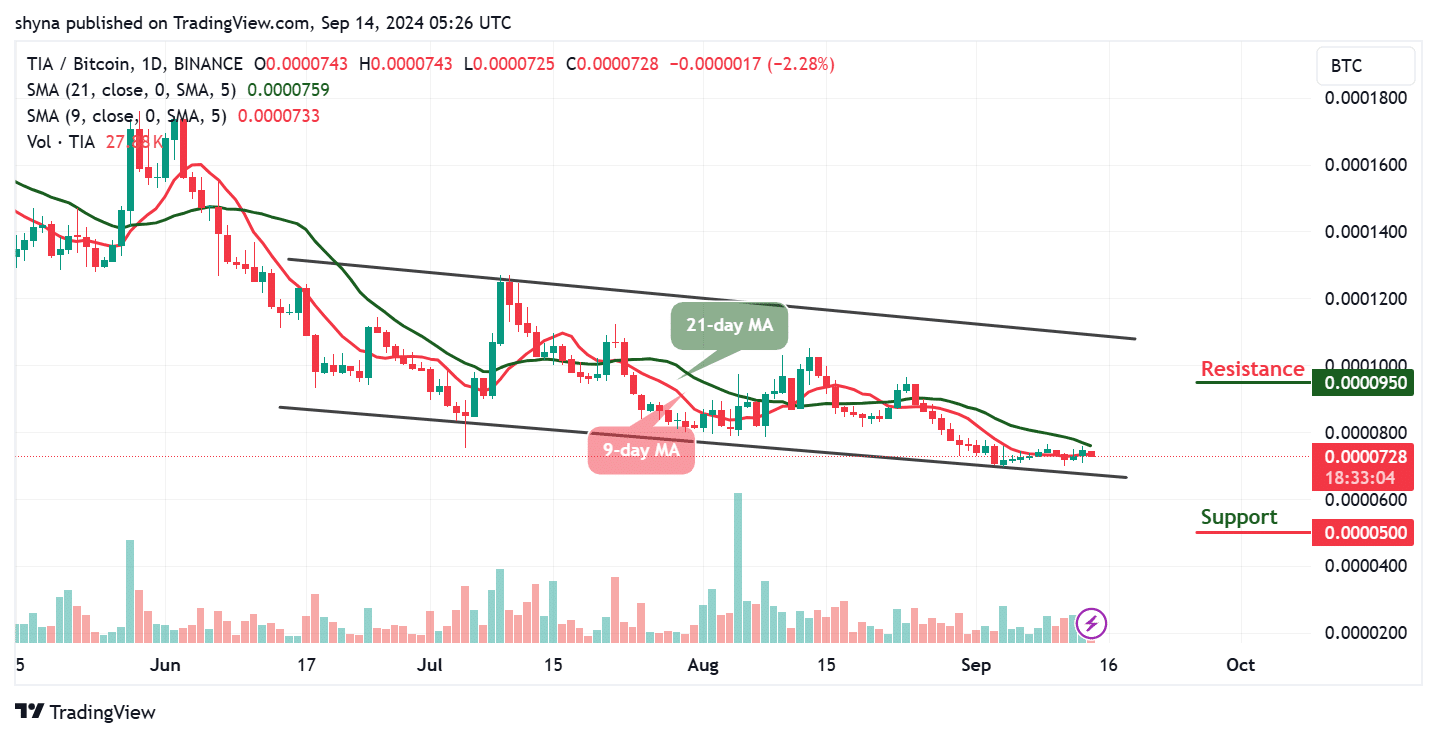
Against Bitcoin, the Celestia price is moving sideways within the descending channel, where the price is likely to head below the 9-day and 21-day moving averages. However, should the price cross below the lower boundary of the channel, the TIA/BTC could hit the support level at 500 SAT and below.

On the contrary, if the bulls step into the market and push the price toward the upper boundary of the channel, it may create potential gains for the coin which could touch the resistance level of 950 SAT and above. Meanwhile, the 9-day MA remains below the 21-day MA, which confirms that the market is been controlled by the sellers.
However, @venture_charts shared an analysis of $TIA with his followers on X (formerly Twitter), highlighting a long position taken yesterday due to the potential for a breakout. The price showed a solid reaction on the daily chart, and ideally, it will pull back into level B or even the 0.66 mark to assess the reaction. However, losing the demand zone at level ‘A’ could raise concerns.
Took a long yesterday as saw the potential for a pop. A pretty decent reaction from the daily. Ideally pulls back into B or even .66 to gauge the reaction.
A loss of the demand zone ‘A’ would be a concern https://t.co/mRZeF0rS0d pic.twitter.com/9WiCE8gJYK
— venture (@venture_charts) September 14, 2024
Celestia Alternatives
Celestia (TIA) is currently trading above its 9-day and 21-day moving averages. If TIA/USD breaks down from the current descending channel, the price could fall significantly below the $4.20 support, continuing its bearish trend. However, Pepe Unchained, a rising token in the cryptocurrency space, has garnered significant attention due to its consistent demand and strong pre-sale performance. With over $13 million in inflows, it stands out in a market where many cryptocurrencies struggle to keep up with daily inflows.
Pepe Unchained Realistic Price Predictions
Pepe Unchained presents a unique opportunity for investors seeking high-reward potential in the rapidly growing meme coin space. With its consistent demand, robust presale inflows exceeding $13.1 million, and plans to develop a Layer 2 blockchain that offers faster transactions and lower fees, Pepe Unchained is well-positioned for significant growth.
Visit Pepe Unchained
Related News
Most Searched Crypto Launch – Pepe Unchained
- Layer 2 Meme Coin Ecosystem
- Featured in Cointelegraph
- SolidProof & Coinsult Audited
- Staking Rewards – pepeunchained.com
- $10+ Million Raised at ICO – Ends Soon
Join Our Telegram channel to stay up to date on breaking news coverage
Credit: Source link


 Bitcoin
  Ethereum
  Tether
  Solana
  XRP
XRP  Dogecoin
  USDC
USDC  Cardano
  Lido Staked Ether
  TRON
TRON  Avalanche
  Toncoin
  Wrapped stETH
  Shiba Inu
  Stellar
  Wrapped Bitcoin
  Polkadot
  Chainlink
  WETH
WETH  Bitcoin Cash
  Sui
Sui  Pepe
Pepe  NEAR Protocol
  LEO Token
  Uniswap
  Litecoin
  Wrapped eETH
  Aptos
Aptos  Internet Computer
  Hedera
  USDS
USDS  Cronos
  Ethereum Classic
  POL (ex-MATIC)
  Render
  Bittensor
  Ethena USDe
  Artificial Superintelligence Alliance
  Arbitrum
  Celestia
  Dai
Dai  Stacks
  Filecoin
  WhiteBIT Coin
  MANTRA
  Bonk
Bonk  OKB
OKB
Comments are closed.